If you’ve ever been frustrated at the amount of time you spend creating PPC reports, you’re not alone. Today, I’ll do my best to help you with a new AdWords script I just finished.
The severity of the reporting problem became very clear to me at a conference I recently attended. Attendees were asked to leave sticky notes describing the most timing-consuming aspects of their jobs. I know it’s not exactly a scientific study, but I found the results fascinating anyway. Here’s what the board looked like:

The orange arrows highlight each note that said “reporting” was the most time-consuming PPC task.
Meetings are another time-consuming task people added to the board several times — but I’m not going to help you fix that with a script, so let me focus on reporting, a topic I’ve covered several times in recent posts here.
When it comes to reporting, you should really try to produce something that gives the stakeholder the data and insights they need, but in such a way that you can easily repeat, and hopefully even automate it. There are plenty of tools that can help with that.
And while automating reports is a reasonable goal, the reality is that there will always be cases where the client wants just one extra piece of data. And because of Murphy’s Law, this will always the one thing your reporting tool doesn’t cover.
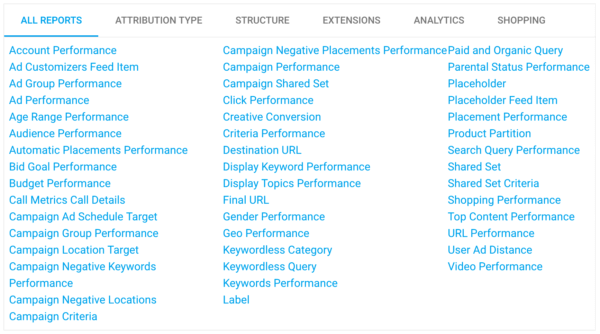
Why don’t reporting tools cover everything? By my last count, AdWords has 46 different types of reports available through their API, ranging from common ones like an account performance report to the more obscure, like the keywordless category report:

Reports available through the AdWords API. Screen shot from the Google Developers Site
In all likelihood, the vast majority of people care about just 10 percent of these reports, so engineering resources get assigned to supporting the most commonly requested reports. And even if a tool covers all 46 possible report types, it might not filter the data the way the client wants, or include some of the lesser used metrics, attributes or segments.
So, how do we get custom data from AdWords into virtually any reporting engine? Through a data connector. And one of the most popular places for marketers to store data is in a spreadsheet.
Google Sheets, just like AdWords, can be automated with App Scripts from Google. This means we can write some code to make the spreadsheet connect with a data source of our choosing. Combined with AdWords scripts, which have permission to access your AdWords data, we can create an automation that lets you specify a template for a report, and then automatically add the requested data on a predetermined schedule.
So, here we go! Let’s get you a free tool to put any AdWords data you want into a Google Spreadsheet.
Step 1: Set up the report template in Google Sheets
Copy this spreadsheet into your own Google Drive. This sheet will look very boring when you first load it, but there are about 600 lines of code in the “Script Editor” section where all the magic happens. This will also be moved to your Google Drive when you copy the script into your own account.
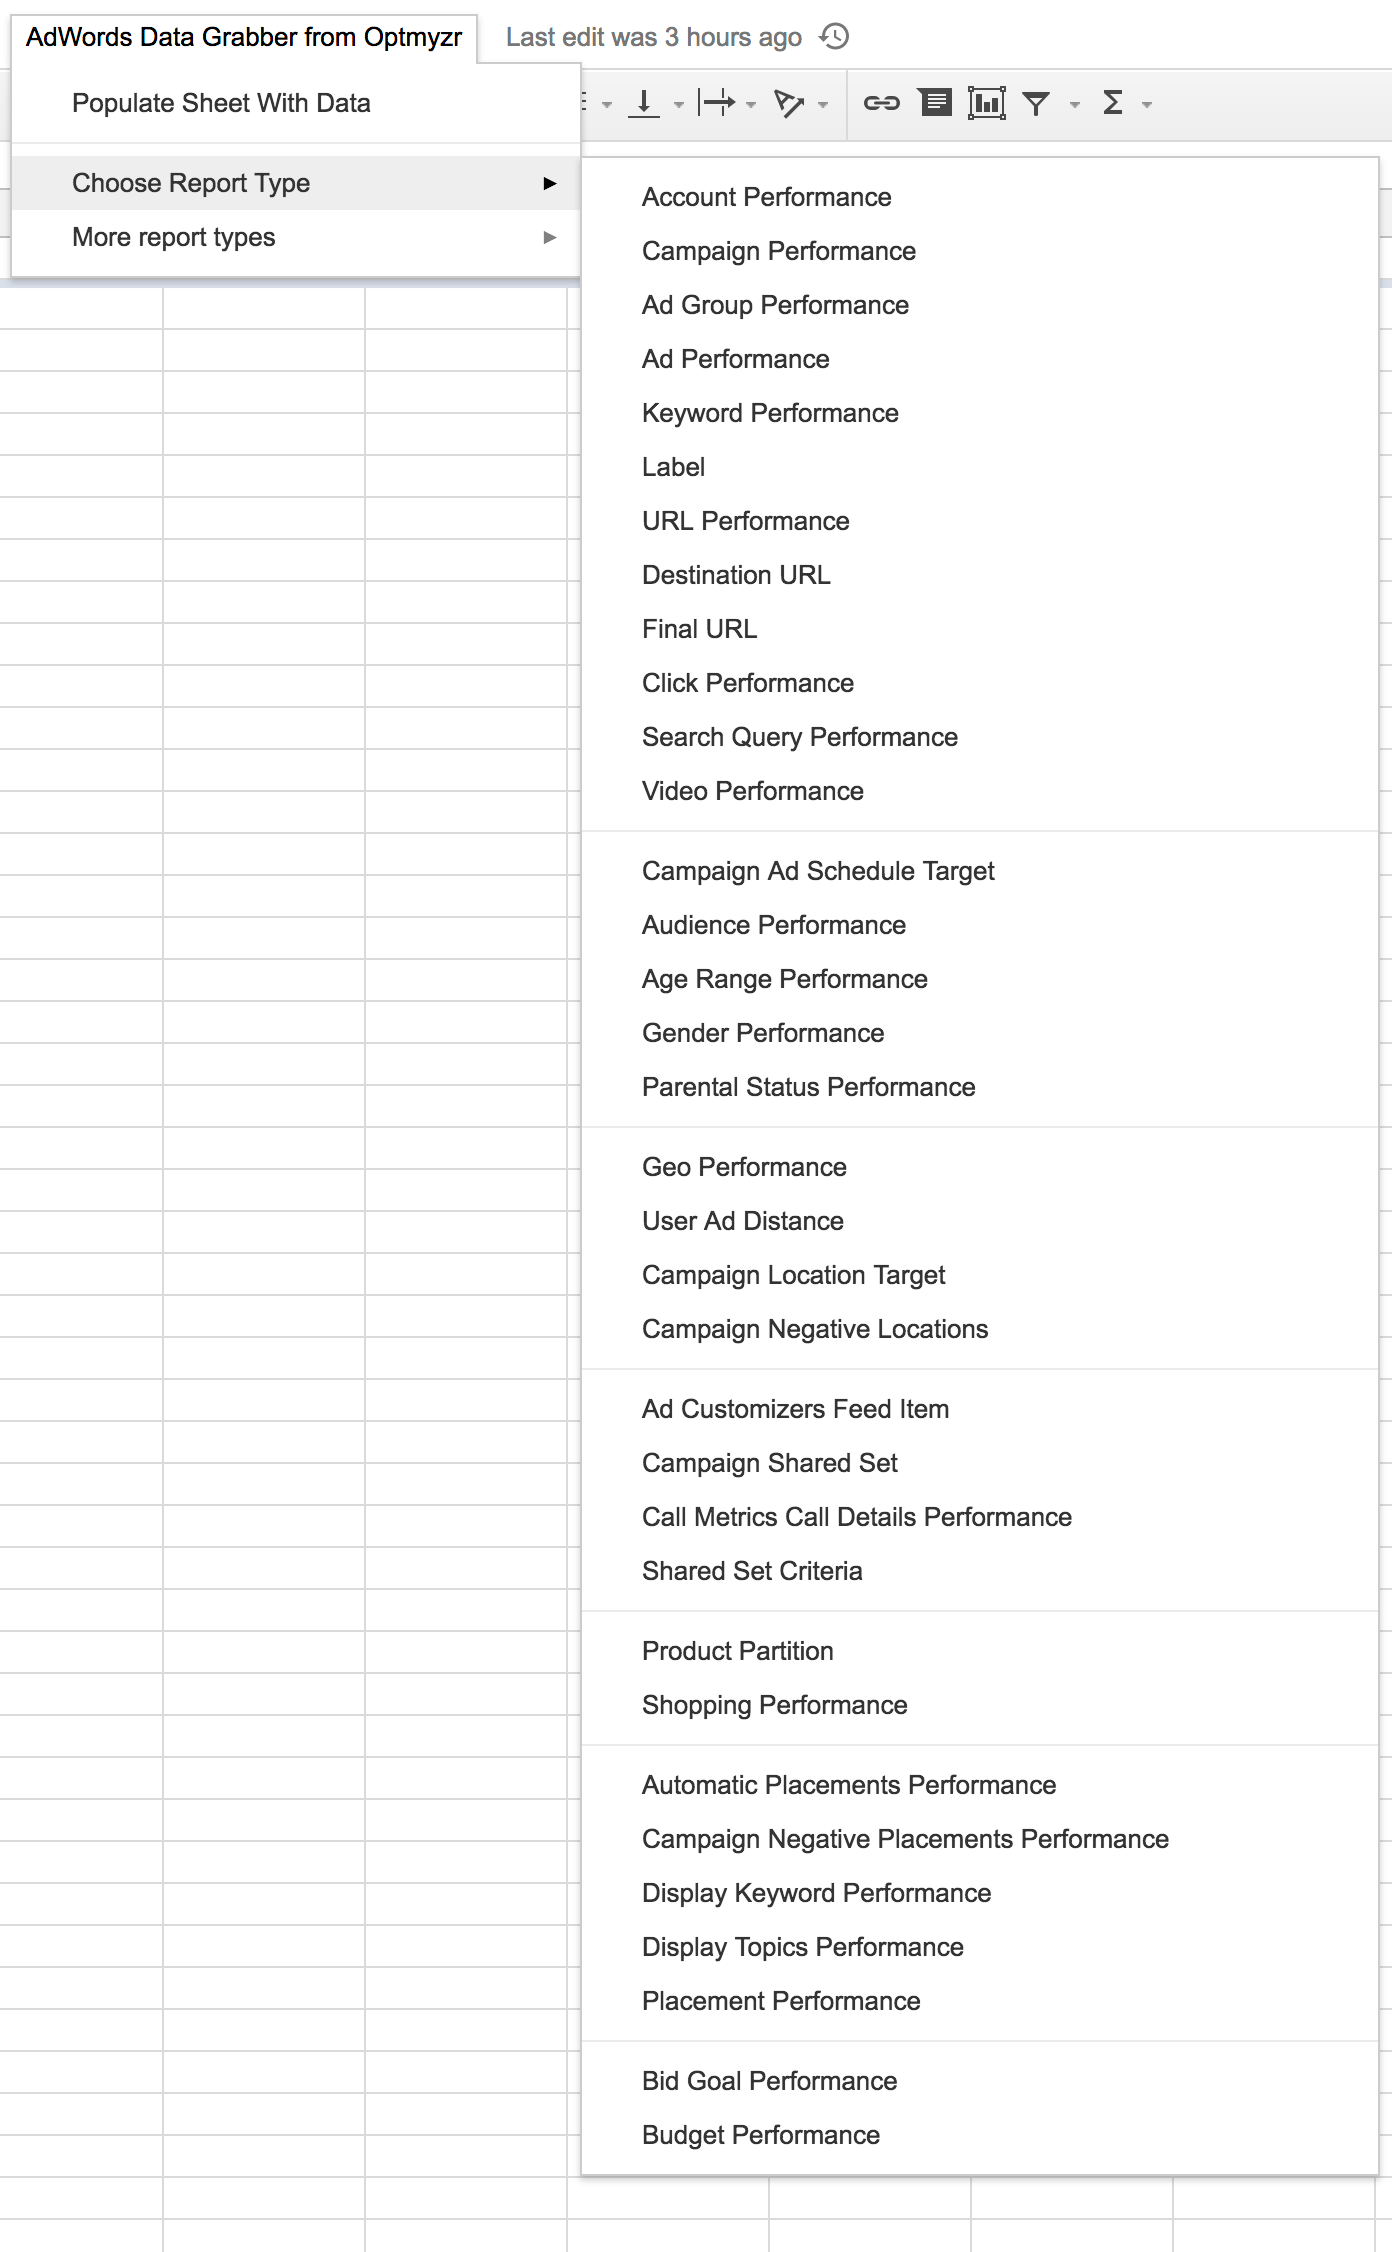
Notice that when the spreadsheet finishes loading, you’ll have a custom menu called “AdWords Data Grabber from Optmyzr.”
Select the type of report you’d like to run from this custom menu:
When you select a report type, the spreadsheet connects with AdWords to get the appropriate attributes, metrics and segments for the selected report. It automatically sets up drop-downs in the spreadsheet to let you choose which elements to include in the report and what filters to apply.
Go to the “Settings” tab and choose a date range for your report from the drop-down. Since the goal is to set this report on an automated schedule, the only options are relative date ranges.
Next, select any filters you want to apply to the data. A pretty common one would be to filter for items that have more than 0 impressions. This step is optional.
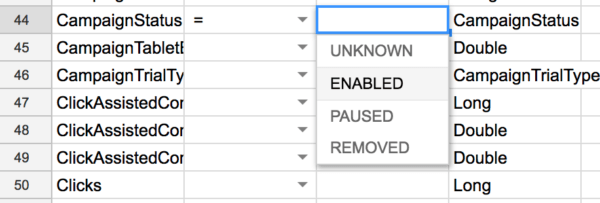
For things where AdWords expects you to choose from a set list of values, the spreadsheet will present you with a drop-down of valid choices, for example, for campaign status, you could choose “ENABLED.”
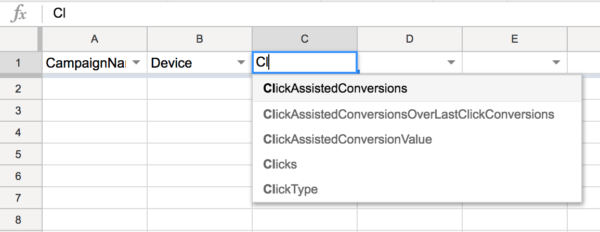
Now, go to the “Report” tab and select the data you want to include in each column. Once again, the spreadsheet will already be loaded with the available options for the report type you have selected.
Step 2: Install the AdWords script
Now to automate the data pulls, simply install the following AdWords script code into your account and set it on a reasonable schedule, like weekly or monthly.
/* // AdWords Script: Put Data From AdWords Report In Google Sheets // ————————————————————– // Copyright 2017 Optmyzr Inc., All Rights Reserved // // This script takes a Google spreadsheet as input. Based on the column headers, data filters, and date range specified // on this sheet, it will generate different reports. // // The goal is to let users create custom automatic reports with AdWords data that they can then include in an automated reporting // tool like the one offered by Optmyzr. // // // For more PPC management tools, visit www.optmyzr.com // */ var DEBUG = 0; // set to 1 to get more details about what the script does while it runs; default = 0 var REPORT_SHEET_NAME = “report“; // the name of the tab where the report data should go var SETTINGS_SHEET_NAME = “settings“; // the name of the tab where the filters and date range are specified var SPREADSHEET_URL = “https://docs.google.com/spreadsheets/d/1dttJTb547L81XYKdTQ56LcfO9hHhbb9wm06ZY5mKhEo/edit#gid=0“; // The URL to the Google spreadsheet with your report template var EMAIL_ADDRESSES = “example@example.com“; // Get notified by email at this address when a new report is ready function main() { var currentSetting = new Object(); currentSetting.ss = SPREADSHEET_URL; // Read Settings Sheet var settingsSheet = SpreadsheetApp.openByUrl(currentSetting.ss).getSheetByName(SETTINGS_SHEET_NAME); var rows = settingsSheet.getDataRange(); var numRows = rows.getNumRows(); var numCols = rows.getNumColumns(); var values = rows.getValues(); var numSettingsRows = numRows – 1; var sortString = ““; var filters = new Array(); for(var i = 0; i < numRows; i++) { var row = values[i]; var settingName = row[0]; var settingOperator = row[1]; var settingValue = row[2]; var dataType = row[3]; debug(settingName + “ “ + settingOperator + “ “ + settingValue); if(settingName.toLowerCase().indexOf(“report type“) != –1) { var reportType = settingValue; } else if(settingName.toLowerCase().indexOf(“date range“) != –1) { var dateRange = settingValue; } else if(settingName.toLowerCase().indexOf(“sort order“) != –1) { var sortDirection = dataType || “DESC“; if(settingValue) var sortString = “ORDER BY “ + settingValue + “ “ + sortDirection; var sortColumnIndex = 1; }else { if(settingOperator && settingValue) { if(dataType.toLowerCase().indexOf(“long“) != –1 || dataType.toLowerCase().indexOf(“double“) != –1 || dataType.toLowerCase().indexOf(“money“) != –1 || dataType.toLowerCase().indexOf(“integer“) != –1) { var filter = settingName + “ “ + settingOperator + “ “ + settingValue; } else { if(settingValue.indexOf(“‘“) != –1) { var filter = settingName + “ “ + settingOperator + ‘ “‘ + settingValue + ‘“‘; } else if(settingValue.indexOf(“‘“) != –1) { var filter = settingName + “ “ + settingOperator + “ ‘“ + settingValue + “‘“; } else { var filter = settingName + “ “ + settingOperator + “ ‘“ + settingValue + “‘“; } } debug(“filter: “ + filter) filters.push(filter); } } } // Process the report sheet and fill in the data var reportSheet = SpreadsheetApp.openByUrl(currentSetting.ss).getSheetByName(REPORT_SHEET_NAME); var rows = reportSheet.getDataRange(); var numRows = rows.getNumRows(); var numCols = rows.getNumColumns(); var values = rows.getValues(); var numSettingsRows = numRows – 1; // Read Header Row and match names to settings var headerNames = new Array(); var row = values[0]; for(var i = 0; i < numCols; i++) { var value = row[i]; headerNames.push(value); //debug(value); } if(reportType.toLowerCase().indexOf(“performance“) != –1) { var dateString = ‘ DURING ‘ + dateRange; } else { var dateString = ““; } if(filters.length) { var query = ‘SELECT ‘ + headerNames.join(“,“) + ‘ FROM ‘ + reportType + ‘ WHERE ‘ + filters.join(“ AND “) + dateString + “ “ + sortString; } else { var query = ‘SELECT ‘ + headerNames.join(“,“) + ‘ FROM ‘ + reportType + dateString + “ “ + sortString; } debug(query); var report = AdWordsApp.report(query); try { report.exportToSheet(reportSheet); var subject = “Your “ + reportType + “ for “ + dateRange + “ for “ + AdWordsApp.currentAccount().getName() + “ is ready“; var body = “currentSetting.ss<br>You can now add this data to <a href=’https://www.optmyzr.com’>Optmyzr</a> or another reporting system.“; MailApp.sendEmail(EMAIL_ADDRESSES, subject, body); Logger.log(“Your report is ready at “ + currentSetting.ss); Logger.log(“You can include this in your scheduled Optmyzr reports or another reporting tool.“); } catch (e) { debug(“error: “ + e); } } function debug(text) { if(DEBUG) Logger.log(text); } In this code, edit lines 17 through 22 with your preferences. The most critical field to update is the one with the URL of the Google spreadsheet we created and modified above.
Now you can preview the script; if your settings are fine, you should see a success message similar to this one:
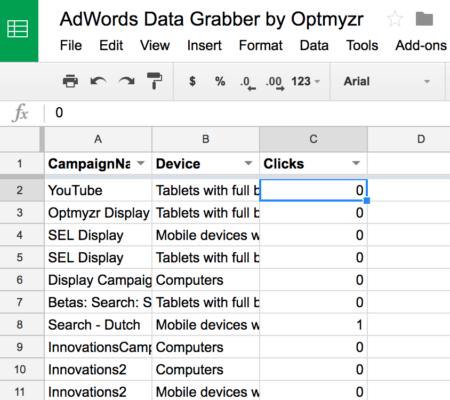
Your spreadsheet should then contain the requested data and could look something like this:
Note: There are many metrics that cannot be combined in reports, for example, conversion type name cannot be reported at the same type as clicks in the campaign report. Checking for this before attempting to populate the report is tricky, so the script will return an error about your error.
When this happens, simply update the headers in the “Report” tab of the spreadsheet and run the script again until all errors are cleared.
Including the data in a report
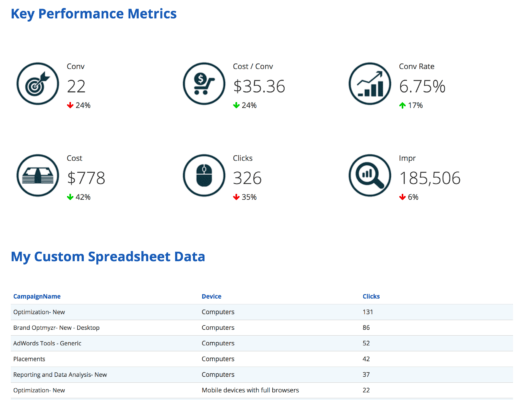
You can use the data as-is in Google Sheets, but you can also include it in automatic scheduled reports. In Optmyzr, you would add a reporting widget that points to the URL of the spreadsheet. The tool then pulls in that data and includes it in the report, using the same styling as the native Optmyzr widgets. Your client won’t be able to tell the difference, and you’ll look like a hero for delivering the custom data they want on an automatic schedule.
Conclusion
PPC reporting takes a ton of time. And because clients invariably have some custom requests for their reports, reporting tools often need some custom integrations to deliver the goods. This AdWords script, together with the Google Apps Script in the spreadsheet, lets you bring custom data from AdWords directly into most reporting engines where you can now automate one more thing.
I hope this script helps you get back a little bit of time to do other things. And if you’re anything like the people who left the sticky notes on the board, I hope you’ll enjoy that next meeting!
Source: This script automates adding any AdWords data to a Google spreadsheet


 If you’ve ever been frustrated at the amount of time you spend creating PPC reports, you’re not alone. Today, I’ll do my best to help you with a new AdWords script I just finished.

 Select the type of report you’d like to run from this custom menu:
 When you select a report type, the spreadsheet connects with AdWords to get the appropriate attributes, metrics and segments for the selected report. It automatically sets up drop-downs in the spreadsheet to let you choose which elements to include in the report and what filters to apply.
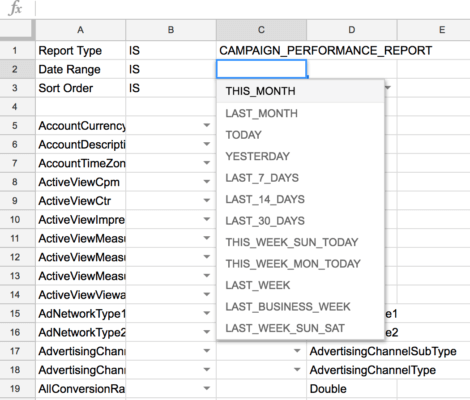 Next, select any filters you want to apply to the data. A pretty common one would be to filter for items that have more than 0 impressions. This step is optional.
 For things where AdWords expects you to choose from a set list of values, the spreadsheet will present you with a drop-down of valid choices, for example, for campaign status, you could choose “ENABLED.”
 Now, go to the “Report” tab and select the data you want to include in each column. Once again, the spreadsheet will already be loaded with the available options for the report type you have selected.
 Now you can preview the script; if your settings are fine, you should see a success message similar to this one:
 Your spreadsheet should then contain the requested data and could look something like this:
 Note: There are many metrics that cannot be combined in reports,
  When this happens, simply update the headers in the “Report” tab of the spreadsheet and run the script again until all errors are cleared.
Recent Comments